Need expert statistical support?

More Info

ASReml-R 4.2 · Updated 2026-08

ASReml-R Quick Reference

Everything you need at your fingertips — from reading data and writing model formulae to variance structures, tests and predictions. Copy any snippet straight into R.

Printable 2-page PDF
Download PDF
01

Fitting a model

Reading data, model formulae, fixed terms, random and residual terms.

Reading Data

Data for analysis using ASReml-R are generally contained in a text file or a spreadsheet and are read into a data frame using the appropriate R functions.

nin89 <- read.table(file = "/path/nin89.csv",
header = TRUE, sep = ",")
VarietyIdpidrawRepnlocyieldlatlongRowColumn
16LANCER111015851429.254.319.2161
17BRULE211026311431.554.320.4171
18REDLAND311037011435.054.321.6181
19CODY411046021430.14.322.8191
20ARAPAHOE511056611433.054.324201
21NE83404611066051430.254.325.2211

Character fields and numeric fields are often not treated as factors, and you must manually convert them into factors as required.

nin89$Rep <- as.factor(nin89$Rep)
nin89$Row <- as.factor(nin89$Row)
nin89$Column <- as.factor(nin89$Column)

The function asreml.read.table() reads data from a text file and automatically converts variates whose names begin with a capital letter in the header line into factors.

nin89 <- asreml.read.table(file = "/path/nin89.csv",
header = TRUE, sep = ",")
Fitting a Model

ASReml-R uses the Wilkinson and Rogers (1973) notation. The model term A:B denotes an interaction or nested effect depending on which other terms are previously included in the model.

asreml(
fixed = y ~ Site,
random = ~ Genotype + Site:Genotype,Use + to add model terms · “:” denotes interaction
data = my_data)
asreml(
fixed = y ~ Site,
random = ~ Site:Genotype,“:” denotes nested effect
data = my_data)

An example of the asreml() call for a simple randomized complete block (RCB) design using nin89 dataframe.

nin89.asr <- asreml(
fixed = yield ~ Variety,
random = ~ idv(Rep, init = 10),Set initial values (optional)
residual = ~ idv(units, init = 50),Set initial values (optional)
na.action = na.method(x = "include"),
data = nin89)

The fixed terms (required) is specified as a formula with the numerical response (yield) on the left of a ∼ operator and the fixed factor (Variety) on the right.

In random and residual the factors (Rep and units) are positioned after the ∼ operator; units is an internal experimental unit factor; and idv() is the homogeneous identity variance structure.

Missing values are allowed in design factors when x = "include". And response records with missing values in the response are included by default with y = "include".

Fixed Terms

The formula here specifies: response, fixed factors, interactions and covariates.

asreml(
fixed = yield ~ Variety, ...)intercept plus Variety
asreml(
fixed = yield ~ -1 + Variety, ...)-1 removes the overall mean
asreml(
fixed = yield ~ 1, ...)intercept-only

If the response term specified is several columns, then a multivariate/multitrait analysis is performed.

asreml(
fixed = cbind(y1,..., yk) ~ trait + x + trait:x, ...)multivariate general mean
Important: trait and units are reserved words.

Random and Residual terms

Each random term needs to be associated to a variance model, idv() is used by default. The examples below use autoregressive matrices for both rows and columns.

sp.asr <- asreml(
fixed = yield ~ Variety,
random = ~ar1v(Column):ar1(Row),ar1v() is a variance model · “:” applies the direct product structure · ar1() is a correlation model
residual = ~idv(units),
data = nin89)

In the previous example, the spatial model is defined as a G structure, and in the following example, it is defined as an R structure.

sp.asr <- asreml(
fixed = yield ~ Variety,
random = ~idv(Rep),
residual = ~ar1v(Column):ar1(Row),data must be sorted as rows within columns
G.param = iv,G.param and R.param to set initial values, if needed
data = nin89)

Conditional Factors

The conditional factor at() is used when another factor depends on specific levels on this factor.

asreml(....,
random = ~ at(Site, 1):Block,equivalent to diag(Site):Block
residual = ~ dsum( ~ idv(units) | Site) , ....)

dsum() is available only for the residual formula and specifies a direct sum, one for each level of the conditioning factor.

02

Variance models

Variance structures and genetic relationship matrices.

Variance Models

ASReml-R has a wide range of variance models that can be used to specify the variance matrix of terms in the random and residual formulae. Some of them are shown below:

σ²
1000010000100001

idv

identity

σ₁²0000σ₂²0000σ₃²0000σ₄²

idh or diag

diagonal

σ²
1ρρρρ1ρρρρ1ρρρρ1

corv

uniform homogeneous

corh

uniform heterogeneous

ar1

1st order autocorrelation

corgh or us

unstructured

The class of general variance models also includes cor, corb, corg, chol, cholc, ante and the factor analytic structure (fa, sfa, facv, rr).

Adding a Genetic Correlation Matrix

harvey.ai <- ainverse(harvey.ped)
adg0.asr <- asreml(
fixed = y3 ~ Line,
random = ~vm(Calf, harvey.ai),vm() variance model function · Calf reference factor · harvey.ai Ainv matrix
residual = ~units,
data = harvey)

The function ainverse() uses the method of Meuwissen and Luo (1992) to compute the inverse of the numerator relationship matrix (NRM) directly from pedigree.

03

Options & model types

Session options, weights, GLMMs and updating models.

ASReml Options

With no arguments, asreml.options() returns a list of settings that can be altered. The full list can be displayed by typing help(asreml.options)

asreml.options(
workspace = "512mb", maxit = 20,
gammaPar = FALSE, ai.sing = TRUE)

The settings are maintained per R session.

Weights

Weighted analyses are achieved by using the weights argument within function asreml()

asreml(...,
weights = wt,variate in the data frame
family = asr_gaussian(dispersion = 1.0), ...)

GLMM

The inclusion of argument family allows for specifying other probability distributions, fitting what is referred to as a Generalized Linear Mixed Model (GLMM).

binnor.asr <- asreml(
fixed = score4 ~ Sex + Grp,
random = ~Sire,
family = asr_binomial(link = "logit",
dispersion = 1, total = NULL),
data = binnor)

The options are Gaussian, Gamma, Poisson, Binomial and Negative Binomial.

Update

The update() function can be used if the model requires further interactions or modifications.

update(nin89.asr)
04

Extracting output

Residual plots, summaries, coefficients and solutions.

Residual Plots

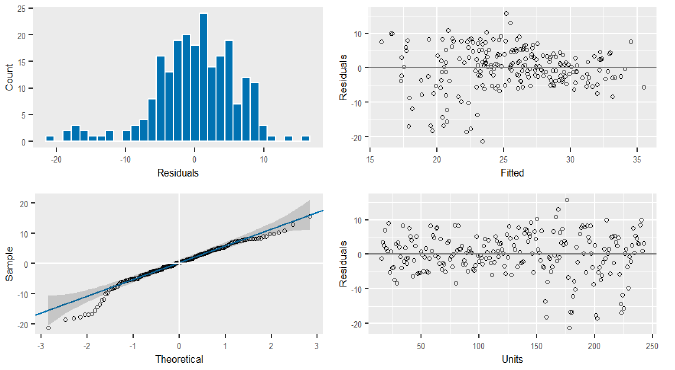
The plot() function used with an asreml object will produce the following four residual plots:

plot(nin89.asr)
Four residual diagnostic plots: histogram of residuals, residuals vs fitted, normal Q-Q plot and residuals vs units

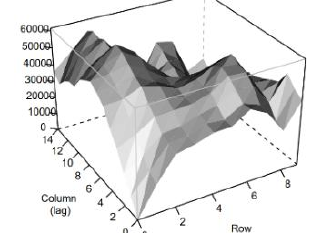
For spatial models the varioGram() will also produce a diagnostic plot.

3D variogram surface plot by column and row lag

Model Summary

The summary() function returns a list with a range of components, such as:

summary(nin89.asr)$logliklog-likelihood value
[1] -454.4691
summary(nin89.asr)$varcompvariance components table
componentstd.errorz.ratiobound%ch
Rep!Rep9.8829118.7928291.123974P0
units!units49.5823685.4588219.082981P0
units!R1.000000NANAF0
summary(nin89.asr)$aicAkaike Information Criterion
[1] 912.9382
summary(nin89.asr)$bicBayesian Information Criterion
[1] 919.1861

Coefficients / Solutions

The coefficients from the fixed and random parts of the model are available in the coef.fixed and coef.random or using coef().

If Variety is a fixed effect = EBLUE
summary(nin89.asr, coef=TRUE)$coef.fixed
solutionstd errorz.ratio
Variety_ARAPAHOE29.43753.8556837.634834
Variety_BRULE26.07503.8556836.762744
Variety_BUCKSKIN25.56253.8556836.629824
Variety_CENTURA21.65003.8556835.615088
If Variety is a random effect = EBLUP
summary(nin89.asr, coef=TRUE)$coef.random
solutionstd.errorz.ratio
Variety_ARAPAHOE7.30E-050.014972090.004875042
Variety_BRULE1.02E-050.014972090.000683157
Variety_BUCKSKIN6.62E-070.014972094.42452E-05
Variety_CENTURA-7.24E-050.01497209-0.004833302
05

Inference & prediction

Wald and LRT tests, predicted means and functions of variances.

Wald Test

The basic tool for fixed effects inference is the wald(), and ANOVA-like table. The asymptotic version is obtained as:

wald(nin89.asr)
DfSum of SqWald statisticPr(Chisq)
(Intercept)1242.054242.054<2e-16 ***
Variety5548.15248.1520.7317
residual (MS)1

The version that obtains degrees of freedom is:

wald(nin89.asr, denDF = "numeric")
dfdenDFF.incPr
(Intercept)13242.10.00058
Variety551650.8750.71185

LRT Test

Function used to compare nested models based on the REML likelihood ratio test implemented with the function lrt()

lrt(model1, model2, boundary = TRUE)
dfLR-statisticPr(Chisq)
model1/model21-7.2562e-060.5

Predict

The predict() method obtains an estimated or predicted values (means) for an element of interest.

rcb.pv <- predict(
object = nin89.asr, classify = "Variety")
rcb.pv$pvals
Varietypredicted.valuestd.errorstatus
ARAPAHOE29.43753.855687Estimable
BRULE26.07503.855687Estimable
BUCKSKIN25.56253.855687Estimable
CENTURA21.65003.855687Estimable
CENTURK7830.30003.855687Estimable

The average standard error of difference (SED) between the predicted means is:

rcb.pv$avsed
# 4.979075

Functions of Variances

The option vpredict() allows to define functions of variance components and their SEs. These are represented by the strings "V1","V2",. . .

vpredict(model, H2 ~ V1/(V1+V2))broad sense heritability

Keep it on your desk

Download the printable two-page ASReml-R Quick Reference.

Download PDF

Want to sharpen your statistics skills?

Browse Courses