
Importing ASReml
import asreml
or
from asreml import (asreml, ainverse,
define_categorical_variables, residual_plot,
variogram)
Need expert statistical support?
More InfoOur statisticians can help with trial design, analysis and interpretation — tailored to your data.
ASReml-Python 1.0.0 · Updated 2026-10
Everything you need at your fingertips — from reading data and writing model formulae to variance structures, tests and predictions. Copy any snippet straight into Python.
Importing ASReml, reading data, model formulae and a first fit.
or
Data for analysis using ASReml-Python are generally contained in a text file or a spreadsheet and are read into a data frame using the Pandas package.
| Variety | Id | pid | raw | Rep | nloc | yield | lat | long | Row | Column | |
|---|---|---|---|---|---|---|---|---|---|---|---|
| 16 | LANCER | 1 | 1101 | 585 | 1 | 4 | 29.25 | 4.3 | 19.2 | 16 | 1 |
| 17 | BRULE | 2 | 1102 | 631 | 1 | 4 | 31.55 | 4.3 | 20.4 | 17 | 1 |
| 18 | REDLAND | 3 | 1103 | 701 | 1 | 4 | 35.05 | 4.3 | 21.6 | 18 | 1 |
| 19 | CODY | 4 | 1104 | 602 | 1 | 4 | 30.1 | 4.3 | 22.8 | 19 | 1 |
| 20 | ARAPAHOE | 5 | 1105 | 661 | 1 | 4 | 33.05 | 4.3 | 24 | 20 | 1 |
| 21 | NE83404 | 6 | 1106 | 605 | 1 | 4 | 30.25 | 4.3 | 25.2 | 21 | 1 |
Character fields and numeric fields are often not treated as factors, and you must manually convert them into factors.
ASReml-Python uses the Wilkinson and Rogers (1973) notation. The model term A:B denotes an interaction or nested effect depending on which other terms are previously included in the model.
An example of the asreml() call for a simple randomized complete block (RCB) design using the nin89 dataframe is shown below.
The response, fixed, random and residual terms are specified as string (use quotation marks) based on the column names in the dataset.
In residual, units is an internal experimental unit factor; and idv() is the homogeneous identity variance structure (see Variance Models).
The options receives a dictionary with internal arguments; e.g. "na_action", where: "x": "include" allows missing values in the design factors and "y": "include" response records with missing values are included.
Response, fixed, random and residual terms.
The formula can specify univariate or multivariate models.
The formula can specify fixed factors, interactions and covariates.
Each random term needs to be associated to a variance model, idv() is assumed by default. The examples below use autoregressive matrices for both rows and columns.
In the previous example, the spatial model is defined as part of the G structure, and in the following example, it is defined as part of the R structure.
Editing starting values and conditioning terms on factor levels.
The fit_options and .initial_values return a dictionary holding of the variance components.
The values can be modified:
The .fit method runs the model with new values.
The conditional factor at() is used when another factor depends on specific levels on this factor.
Structures for the random and residual formulae.
ASReml-Python has a wide range of variance models that can be used to specify the variance matrix of terms in the random and residual formulae. Some of them are shown below:
idv
identity
idh or diag
diagonal
corv
uniform homogeneous
corh
uniform heterogeneous
ar1
1st order autocorrelation
corgh or us
unstructured
The class of general variance models also includes cor, corb, corg, chol, cholc, ante and factor analytic structures (fa, sfa, facv, rr).
Pedigree matrices, other distributions and weighted analyses.
The function ainverse() computes the inverse of the numerator relationship matrix from provided pedigree.
| Calf | Sire | Dam | |
|---|---|---|---|
| 0 | Sire_1 | 0 | 0 |
| 1 | Sire_2 | 0 | 0 |
| 2 | Sire_3 | 0 | 0 |
| 3 | Sire_4 | 0 | 0 |
| 4 | Sire_5 | 0 | 0 |
| rowid | colid | vals | |
|---|---|---|---|
| 0 | 1 | 1 | 3.666667 |
| 1 | 2 | 2 | 3.666667 |
| 2 | 3 | 3 | 2.666667 |
| 3 | 4 | 4 | 3.666667 |
| 4 | 5 | 5 | 3.333333 |
The variance model function vm() allows the use of the inverse of a numerator relationship matrix or one generated from a genomics data.
The inclusion of argument family allows for specifying other probability distributions, fitting what is referred to as a Generalized Linear Mixed Model (GLMM).
The family options are: gaussian, gamma, poisson, binomial and negative_binomial.
Weighted analyses are implemented by using the weights argument within function asreml().
Residual diagnostics and the spatial variogram.
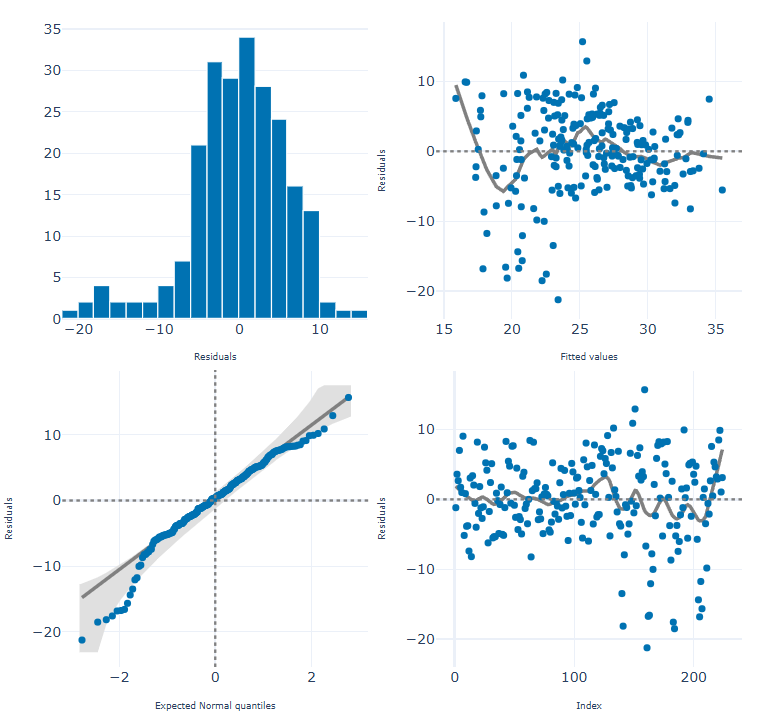
The residual_plot() function used with an asreml object will produce the following four residual plots:
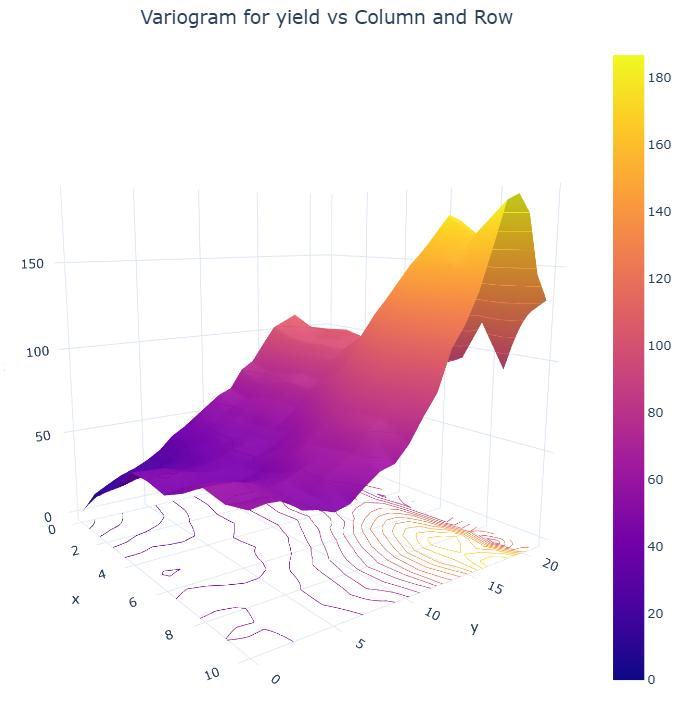
For spatial models the variogram() will also produce a diagnostic plot based on the spatial model fitted.
Summary statistics, variance components and solutions.
The summary() function returns a list with a variety of elements, such as:
| gamma | sigma | std.error | bounds | %ch | |
|---|---|---|---|---|---|
| idv(units)!units!SCA_V | 1.000000 | 49.582380 | 5.458841 | P | 0 |
| idv(Rep)!Rep!ID_V | 0.199323 | 9.882913 | 8.792661 | P | 0 |
The coefficients (or solutions) from solving the mixed model equations for the fixed and random parts of the model are in .coefficients().
| estimate | standard_error | |
|---|---|---|
| Variety_ARAPAHOE | 0.0000 | 0.000000 |
| Variety_BRULE | -3.3625 | 4.979075 |
| Variety_BUCKSKIN | -3.8750 | 4.979075 |
| Variety_CENTURA | -7.7875 | 4.979075 |
| Variety_CENTURK78 | 0.8625 | 4.979075 |
Wald tests, predicted means and functions of variances.
The basic tool for fixed effects inference is the Wald (ANOVA-like) table. The option that calculates degrees of freedom is:
| NumDF | DenDF | F-inc | F-con | M | P-con | |
|---|---|---|---|---|---|---|
| mu | 1 | 3.0 | 242.057101 | 242.057101 | . | 0.000577 |
| Variety | 55 | 165.0 | 0.875490 | 0.875490 | A | 0.711853 |
The predict method obtains estimated or predicted means for an element or factor of interest.
| Variety | Pred Values | s.e. | Ecode | |
|---|---|---|---|---|
| 0 | ARAPAHOE | 29.4375 | 3.855683 | E |
| 1 | BRULE | 26.0750 | 3.855683 | E |
| 2 | BUCKSKIN | 25.5625 | 3.855683 | E |
| 3 | CENTURA | 21.6500 | 3.855683 | E |
The vpredict allows to define functions of variance components and estimate their standard error. These are represented by the strings "V1", "V2"…
| estimate | std.error | |
|---|---|---|
| ICC | 0.166196 | 0.124396 |
Keep it on your desk
Download the printable two-page ASReml-Python Quick Reference.
Want to sharpen your statistics skills?
Browse CoursesSelf-paced online training covering our software and applied statistical methods.